|
Remote sensing is a recognized tool for detecting
and mapping the surface indicators of potential groundwater accumulation, storage, transmission, and recharge. Observable
indicators on satellite imagery and aerial photography include regional tectonics, fractures and lineaments, drainage patterns,
lithologies, soils, and vegetation anomalies. When combined with regional geological and meteorological information and local
hydrologic data, groundwater potential can be assessed and prospective targets ranked according to their probable suitability
as aquifers.
This type of analysis can vary from regional
assessments and the mapping of surface drainage, seasonally flooded areas, aquifer recharge areas, and general lithology/aquifer
identification to more detailed investigations involving all aspects of hydrologic exploration. Detailed exploration includes
assessments of flow from potential aquifers based on existing or test well data, location of producible fractures, drilling,
and distribution of the water found. A hydrologic analysis is a combination of the geologic structure, lithologic, lineament
(potential fractures), and chemical analyses plus identification of specific drilling locations. |
|
|
|

For Water Exploration/Management
studies, EarthSat generally performs our standard lithology and structural interpretation but we expand our interpretation to also include maps of Hydrolithologic Units
(i.e., geologic maps that group together formations with similar water-bearing properties). Our structural analysis is used
to evaluate groundwater flowpaths.
|
|
In a recently completed exercise for NASA, we
found that when 1 meter resolution data is used, the accuracy of QRVV is within +/- 5 degrees of strike, and +/- 3 degrees
of dip. For more information on QSM and QRVV click on one of the slide presentations below:
- For Internet Explorer users (4.0
and above) click here.
- For Netscape users (Internet Exlorer
3.0) click here.

In areas as diverse
as Western New York, Central Texas, the Powder River Basin, and Central China, there is a strong correlation between high
density fractures mapped from remotely sensed data and fluid (water or hydrocarbon) production. Where accumulation is related
to fracture porosity and permeability (e.g., Texas and China), the relationship is anticipated. However, in areas with other
structural and stratigraphic conditions, the relationship also persists.
Faulting and fracturing influence the
location of channels and offshore bars; differential compaction over buried sand or carbonate bodies may produce higher fracture
density.
 Both density and orientation of fractures are important factors. Areas of high fracture
density are the most attractive, and wells that encounter relatively open-standing fractures (those parallel to maximum principal
compressive stress in most areas) are the most prolific. Both density and orientation of fractures are important factors. Areas of high fracture
density are the most attractive, and wells that encounter relatively open-standing fractures (those parallel to maximum principal
compressive stress in most areas) are the most prolific.
 Digital technology allows one to rapidly digitize fractures, compute and map fracture
density, and analyze fracture orientation. Digital technology allows one to rapidly digitize fractures, compute and map fracture
density, and analyze fracture orientation.
The approach is useful for identifying new exploration
targets, extending producing trends, choosing optimal location for development wells, and selecting the orientation of horizontal
well bores. Fracture analysis is relatively inexpensive and, like all other tools, is best used in concert with sound geologic
thinking and other conventional tools and techniques. Find out more about fracture analysis including such topics as:
- Factors in planning a successful
fracture analysis
- Interpretation of results
- Example - Powder River Basin
|
|
|
 |
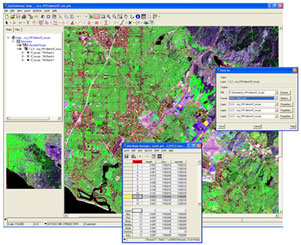
Example of a Hydrolithologic Unit (Click to
Enlarge) | | |
|
|
 In addition, we compile information on geochemical factors that could affect water
quality. For example, groundwater in formations containing a high percentage of evaporitic minerals such as anhydrite is generally
very saline and may not be suitable for consumption or other use. In addition, we compile information on geochemical factors that could affect water
quality. For example, groundwater in formations containing a high percentage of evaporitic minerals such as anhydrite is generally
very saline and may not be suitable for consumption or other use.

 EarthSat
pioneered the concept of Virtual Field Trips in the late 1980's with the development of a 3-D mapping technology that resulted
in quantitative measurements. This technique involves integrating a digital elevation model (DEM) with high-resolution imagery
to locate features in both horizontal and vertical space. This Quantitative Structural Mapping (QSM) technology has been used
in Yemen to obtain hundreds of measurements of the top of the Umm Er Rhadhuma Formation in just one day. We also verified
that the satellite imagery is very useful for mapping beds with very subtle dips (1 to 2 degrees) that are difficult to measure
in the field. This approach reduces the amount of field work required, and increases exploration efficiency by identifying
areas where particular attention is needed to resolve geologic questions. EarthSat
pioneered the concept of Virtual Field Trips in the late 1980's with the development of a 3-D mapping technology that resulted
in quantitative measurements. This technique involves integrating a digital elevation model (DEM) with high-resolution imagery
to locate features in both horizontal and vertical space. This Quantitative Structural Mapping (QSM) technology has been used
in Yemen to obtain hundreds of measurements of the top of the Umm Er Rhadhuma Formation in just one day. We also verified
that the satellite imagery is very useful for mapping beds with very subtle dips (1 to 2 degrees) that are difficult to measure
in the field. This approach reduces the amount of field work required, and increases exploration efficiency by identifying
areas where particular attention is needed to resolve geologic questions.
These concepts evolved into our Quantitative
Regional Visualization and Verification (QRVV) tool, which enables the user to visit a field site on a digital analytical
stereo workstation.  First, ground control points are chosen on a 3-D rendition of key marker beds. Then a three-point solution (TIN) is created
using the x,y,z control points and the strike and dip of beds and other field characteristics can be calculated automatically.
These measurements can be reprojected to recreate the marker bed geometry and identify potential hydrocarbon traps. They are
also useful for calculating the true stratigraphic thickness of outcrops. First, ground control points are chosen on a 3-D rendition of key marker beds. Then a three-point solution (TIN) is created
using the x,y,z control points and the strike and dip of beds and other field characteristics can be calculated automatically.
These measurements can be reprojected to recreate the marker bed geometry and identify potential hydrocarbon traps. They are
also useful for calculating the true stratigraphic thickness of outcrops. |
|